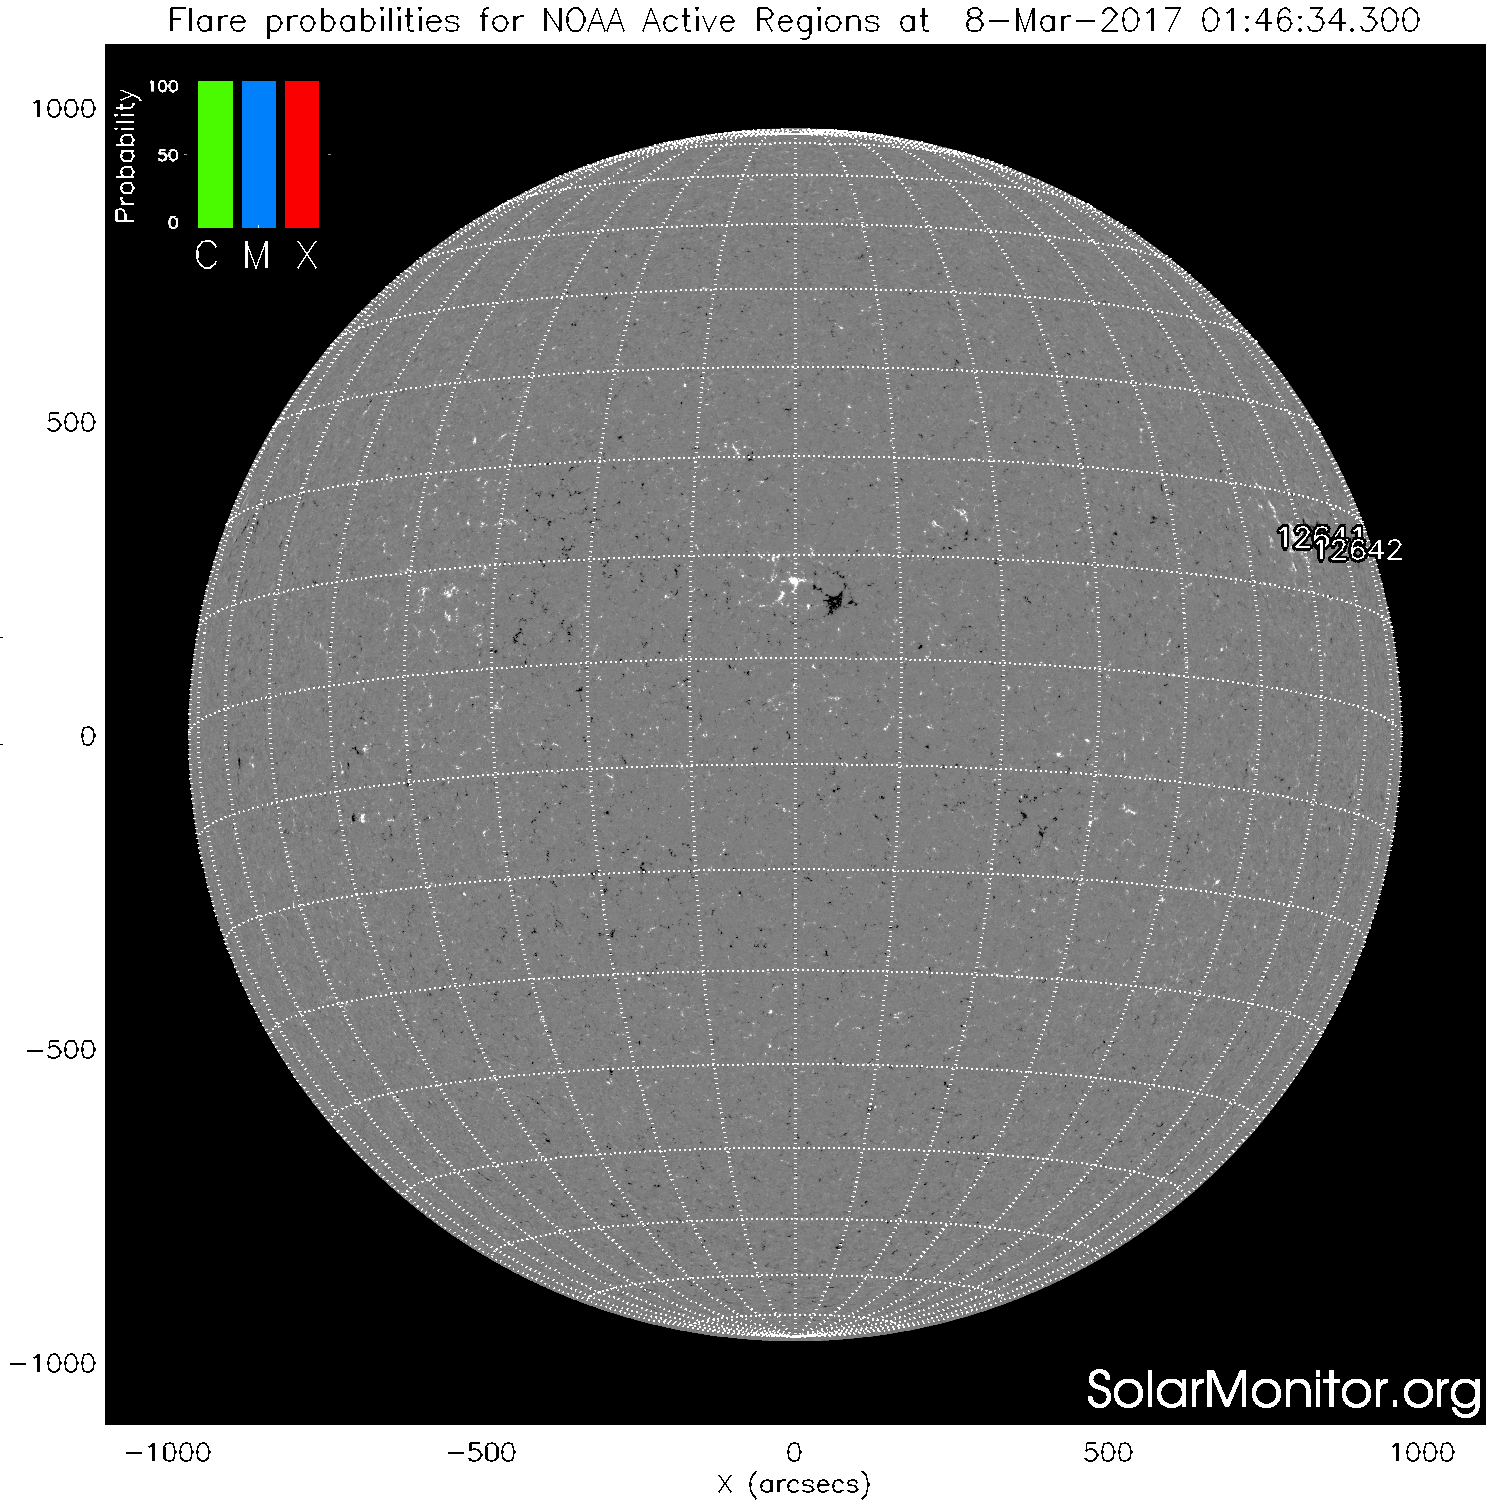
Solar Monitor's flare prediction system's probabilities are calculated using NOAA Space Weather Prediction Center data. There are two main methods, MCSTAT and MCEVOL, that use sunspot-group McIntosh classifications and Poisson statistics to calculate flaring probabilities valid for a 24-hr period*. The flaring probabilities are calculated using historical data from the periods 1969-1976 & 1988-1996 (MCSTAT) and 1988-2008 (MCEVOL).
MCSTAT – Uses point-in-time McIntosh classifications to calculate Poisson flaring probabilities. Details about the method [1] and forecast verification testing [2] can be found in the following papers:
[1] Gallagher, P. T., Moon, Y.-J., Wang, H., Solar Physics, 209, 171, (2002)
[2] Bloomfield et al., 2012, The Astrophysical Journal Letters, 747, L41 MCEVOL – Uses the evolution of McIntosh classifications over a 24-hr period to calculate Poisson flaring probabilities. Details about the method and flaring rate statistics can be found in the following:
[1] McCloskey, A.E., Gallagher, P.T. & Bloomfield, D.S., Solar Physics, 291, 1711, (2016) Further Reading:
Wheatland, M. S., 2001, Solar Physics, 203, 87
Moon et al., 2001, Journal of Geophysical Research-Space Physics, 106(A12) 29951
Notes:
'...' = McIntosh class or evolution was not observed in the period over which the Poisson flare rate statistics were determined.
* When viewed in real-time and before 22:00 UT, NOAA predictions are valid up to 22:00 UT on the current date. When viewed in real-time after 22:00 UT (or when viewing past dates), NOAA predictions are valid up to 22:00 UT on the following date. The most recent data can also be found at NOAA's 3-day Space Weather Predictions page.
Please contact Peter Gallagher if you have any queries regarding this research.
|

