
11785
11787
11789
|
|||||||||||||||||||||||||||||
|
|
|
|||||||||||||||||||||||||||
|
|||||||||||||||||||||||||||||


| Today's/Yesterday's NOAA Active Regions | ||||||
NOAA Number |
Latest Position |
Hale Class |
McIntosh Class |
Sunspot Area [millionths] |
Number of Spots |
Recent Flares |
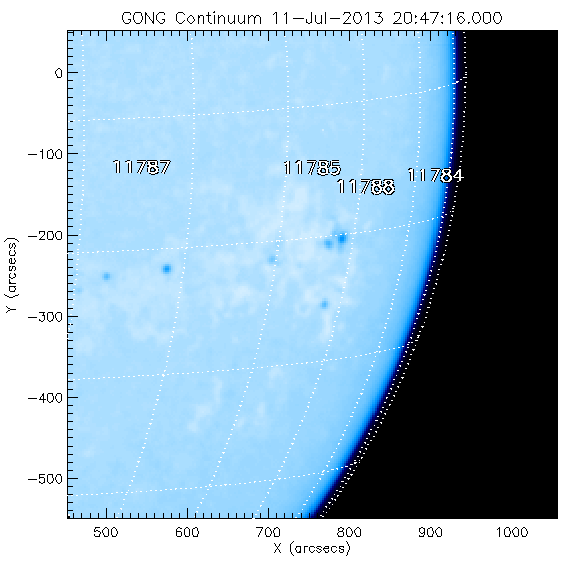
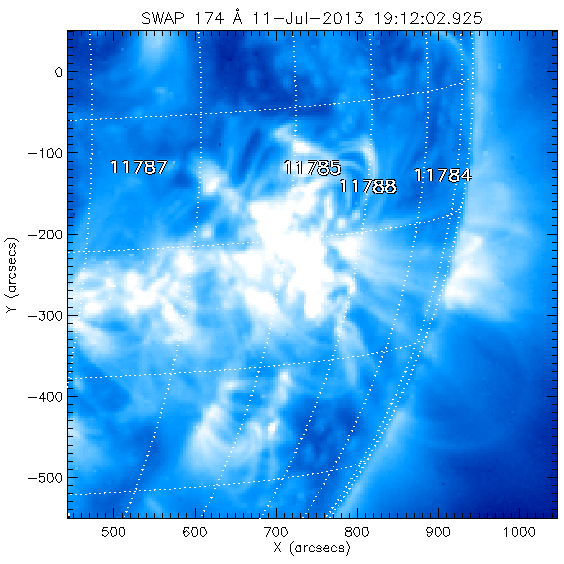
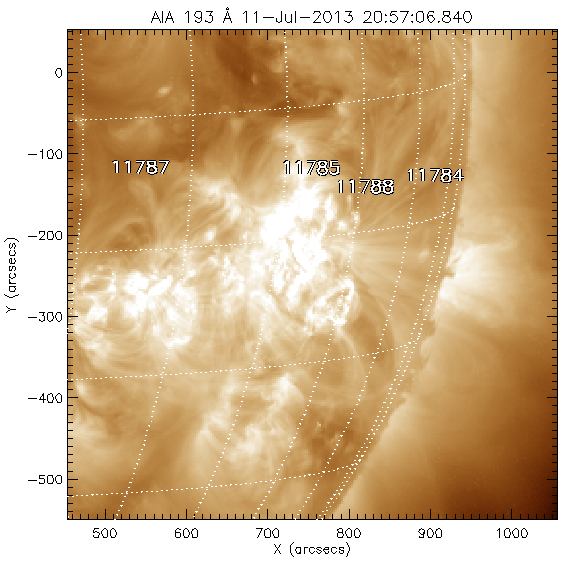
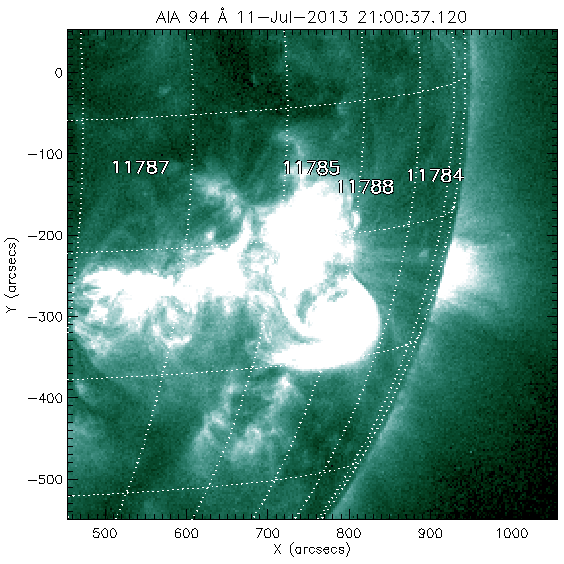
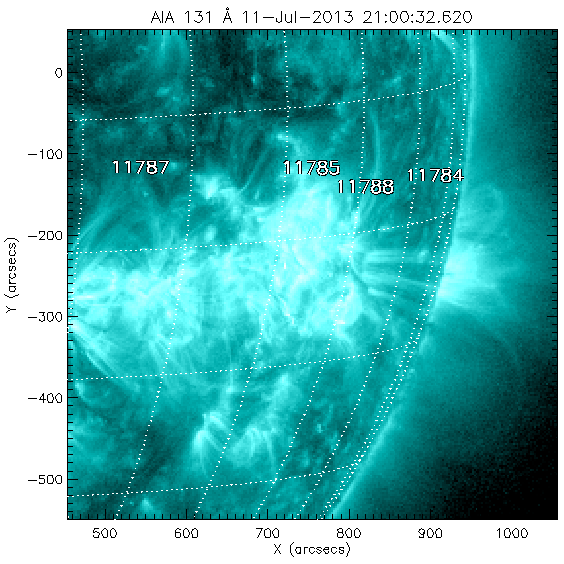
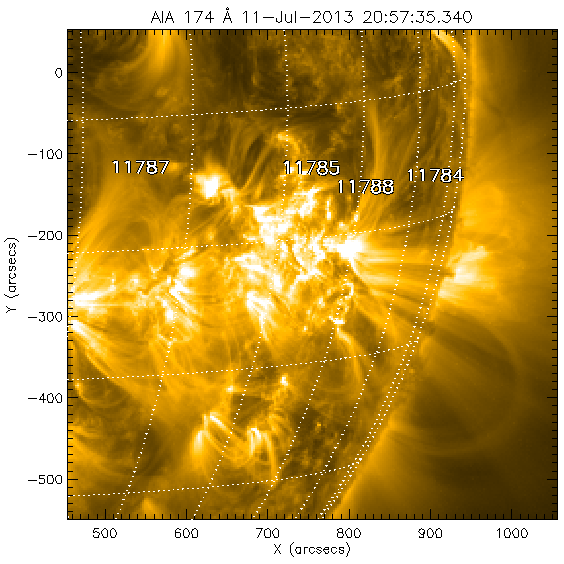
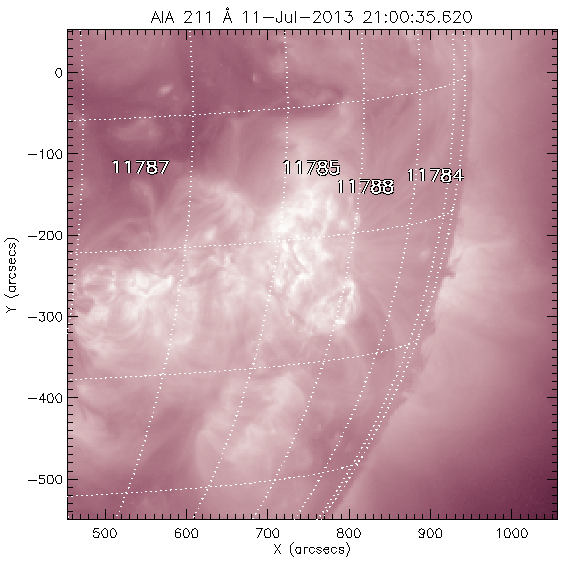
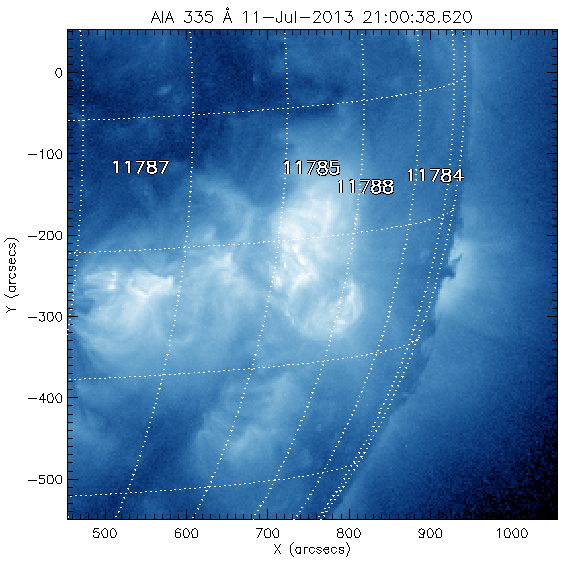
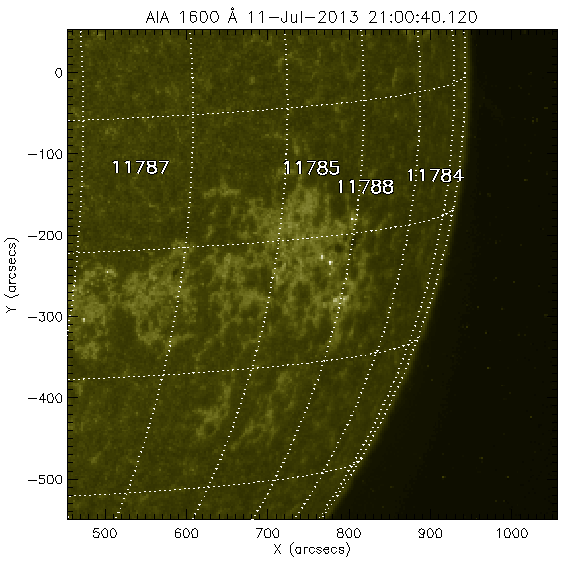
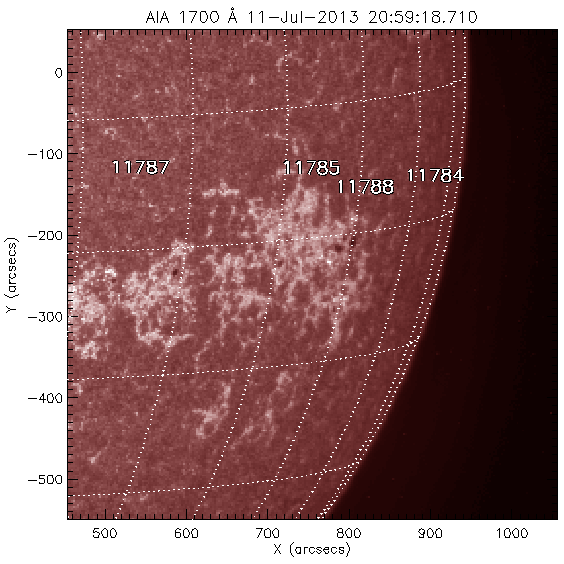
| 11785 | S13W57 (776",-272") |
βγδ/βγδ | Ekc/Ekc | 0320/0480 | 39/42 | C1.3(23:55) C2.6(17:49) C1.4(17:05) / C2.0(23:50) |
| 11787 | S12W38 (572",-284") |
βγδ/βγδ | Eai/Eai | 0120/0230 | 17/23 | - / C4.9(06:24)
C1.3(00:46) |
| 11789 | S28W38 (516",-522") |
αγδ/- | Axx/--- | 0010/---- | 02/-- | - |
Class (HH:MM) -Today
Class (HH:MM) -Yesterday
|
Events not associated with currently named NOAA regions: C1.0(09:04) |
|
Note: The tabulated data are based on the most recent NOAA/USAF Active Region Summary issued on 11-Jul-2013 00:30 UT . The greyed out and light-blue entries are values from the previous day. Slashed cells indicate that the active region has no spots. The latest positions of the active regions are given in both heliographic and heliocentric co-ordinates. The region positions are valid on 11-Jul-2013 21:00 UT . |